The common wisdom of trading strategy development forums and online communities suggests that trading algos can be divided into two major groups: trend-following and mean-reversion-based strategies.
Well, this is fundamentally true, but we should not forget about other exciting strategy types as well:
- pattern-based strategies
- seasonality strategies
- daily, weekly or monthly bias-based strategies
Now, let’s stick a little bit with bias-based strategies. This strategy type utilizes an important underlying characteristic of the traded market: the average statistical change during a specific time interval over and over again. This time interval can be set during a trading day, a trading week or an entire month.
Bias-based strategIES in EasyLanguage
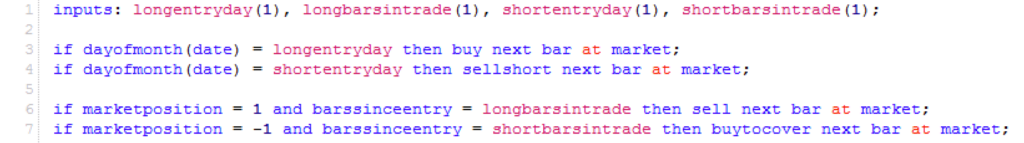
Let’s do a small experiment. My goal now is to find a couple of days each month when buying or selling Crude Oil during an average trading month has an edge. To start our research project, I prepared a very simplistic, Easy Language code that enters one long and one short trade each month. Both the entry day and the length of the trade are optimizable parameters (on the long and short side as well):
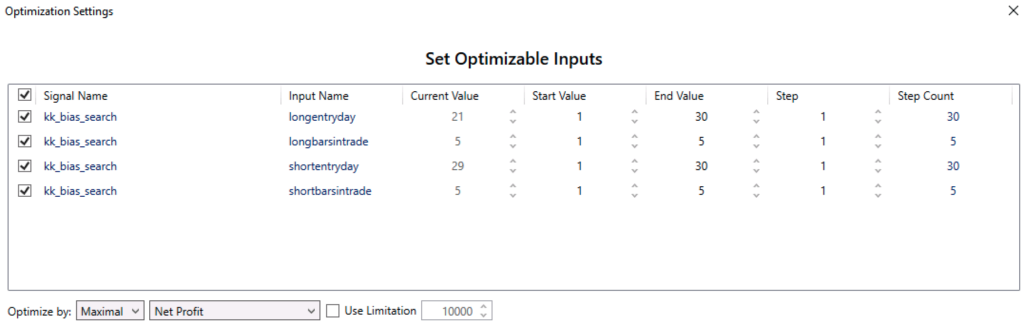
Our next step is scheduling optimization for long entry dates, long trade lengths, short entry dates and short trade lengths.
Before analyzing the collected results, there is an important point I’d like to raise. When performing algo research, I ensure that reasonable slippage and commission are configured for the appropriate market. In this example, we are working with Crude Oil (CL). I set a $30 roundtrip slippage and a $2.5 broker commission per trade. Why is this important? We often find great looking edges with small average trade sizes when working with strategy optimizers, especially with bias-based strategies. When trading these edges in real life, the actual broker commission and the trade execution slippage can easily melt these edges away. A properly configured slippage and commission values can ensure realistic expectations. With all that in mind, let’s have a look at the optimization results:
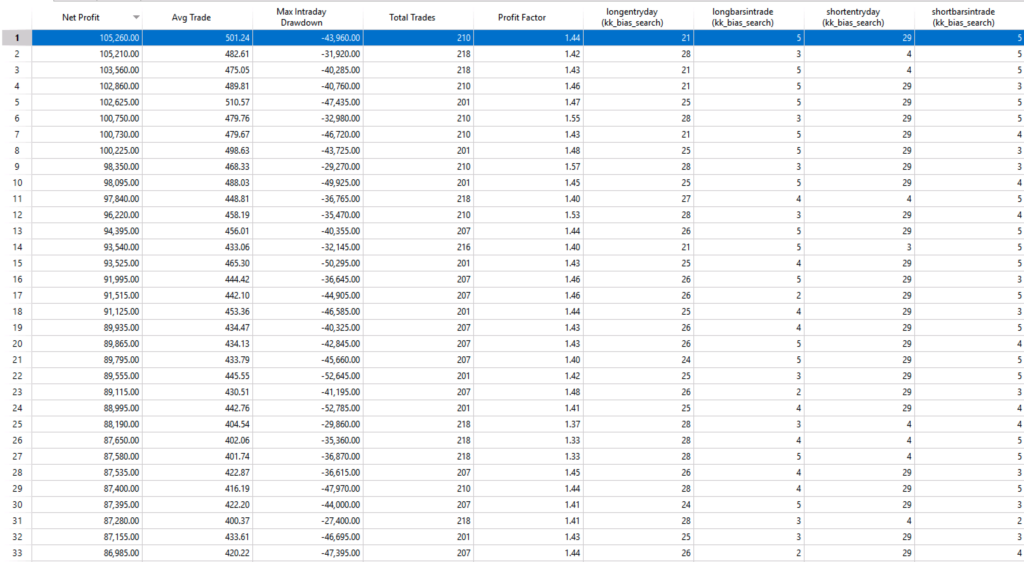
As you can see, the optimizer listed many long and short entries using variable trade lengths with positive expectations. Before choosing the optimal parameters, consider the Net-Profit, the Average-Trade, Max-Intraday-Drawdown and Profit factor values. When developing bias-based strategies, I prefer to select one of the largest average trade sizes from the optimizer output list.
In this case, these values represent the following trading system for Crude Oil (CL):
- go long on the 21st day of each month and let this trade run for 5 days
- go short on the 29th day of each month and let this trade run for 5 days
This trading system utilizes an interesting up-down oscillation of Crude Oil close to the end of each month.
Let’s have a look at the backtesting results of this edge:
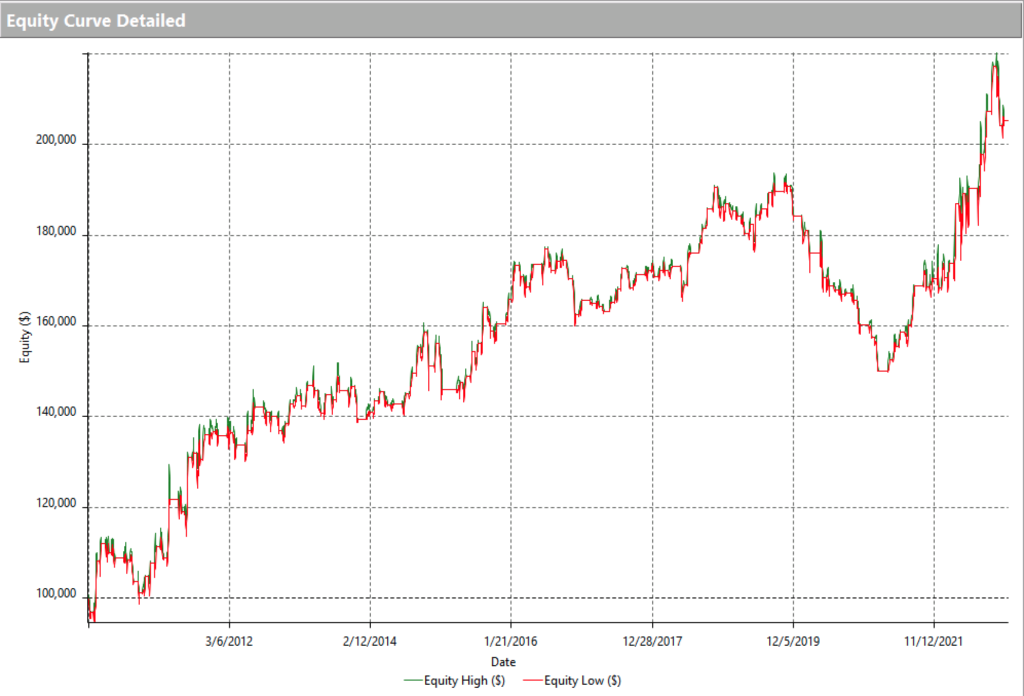
We found a very simplistic but steady bias-based edge for Crude. Can we consider it as a trading system or a market-ready algo? Probably not, but we are pretty close to it. If you’re planning to build your own algo based on this edge, I recommend you add a stop-loss, profit target and perhaps an entry filter rule. In a future article, I will write more about the trading system development steps I would like to follow.
Algo-research on the assembly line
Now let’s bring our research project to the next level. Why did I pick Crude for my initial research? I’m not sure. It was a somewhat random idea. Actually, what I really try to find is the top 3 Futures market symbol with the most substantial monthly bias edge. How can we have this information without spending significant time in front of the optimizer? Let’s use Tradesq to scan multiple Futures markets for similar monthly bias edges.
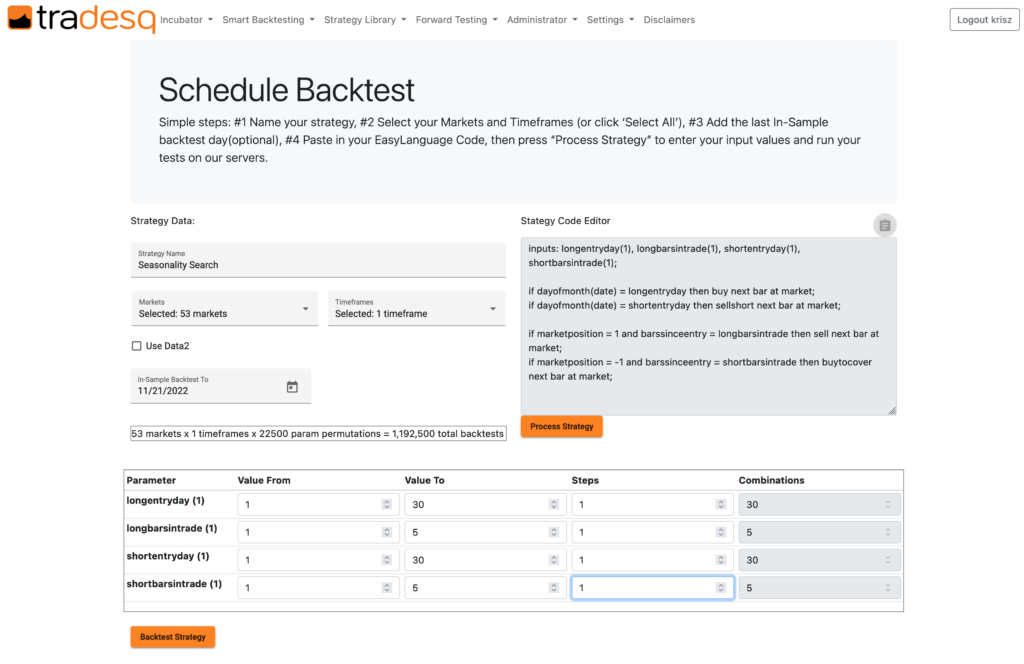
Logging into Tradesq, let’s navigate to the Schedule Backtest function in the Smart backtesting menu. In the scheduler screen, we paste our EasyLanguage strategy code to the code editor box, and we choose daily or 1440 minutes timeframe for this experiment. The next step is to specify which symbols to include in the research. Tradesq currently supports 45 future market symbols across multiple sectors (index, currency, metal, interest rates, etc.). For the sake of versatile results, let’s choose them all. At the bottom of the screen, we can specify the optimization ranges and values of our EasyLanguage variables as we did during our initial research on the desktop.
When Tradesq finishes testing, we see that we received good results from 23 symbols. Based on these results, we can conclude that the currency, energy, grain, index, interest rate, metal and meat sectors show solid monthly bias properties. This represents the majority of the futures market.
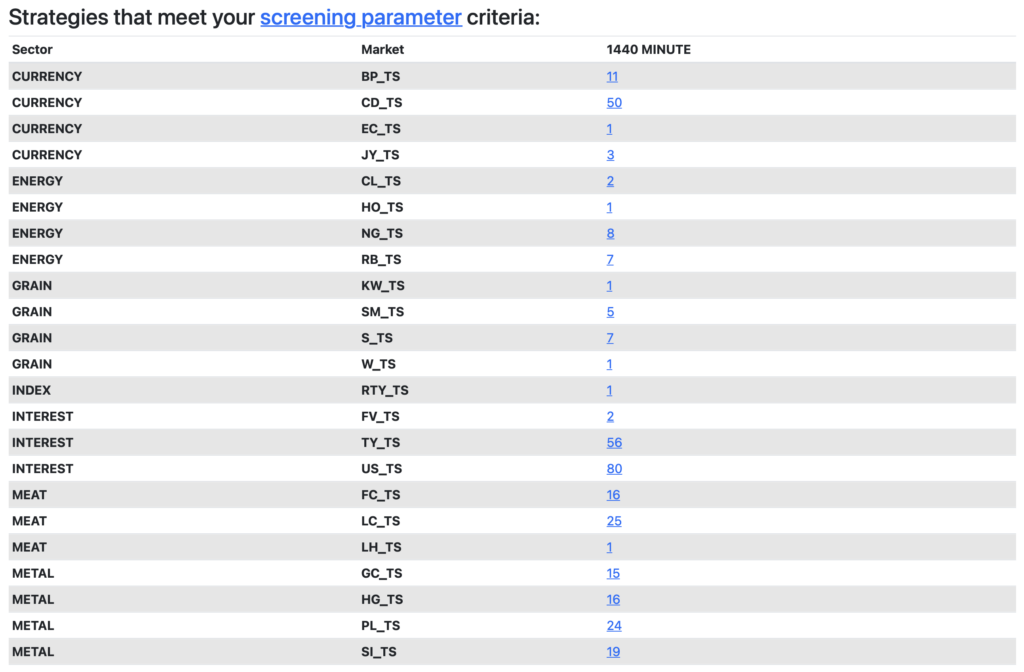
Our last goal is to determine the best 3 symbols for the monthly bias system. Let’s ask Tradesq’s help again. Using the Strategy Library / Strategy Screener function, all search results can be listed ordered by R2 value (smoothness of the equity curve). The top 3 results are:
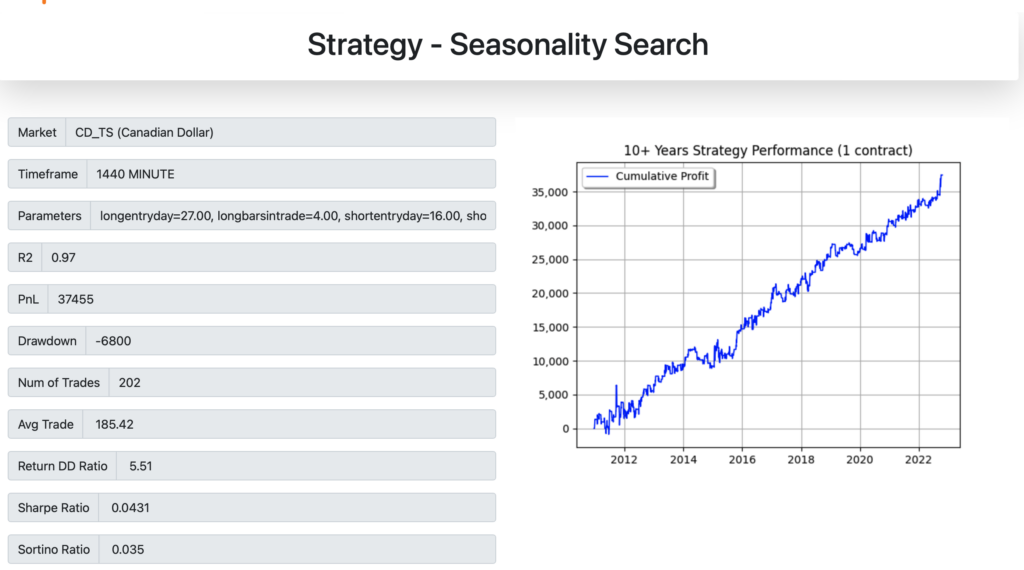
- Canadian Dollar (CD) using parameters longentryday=27, longbarsintrade=4, shortentryday=16, shortbarsintrade=4
- 5 Years US Treasury Note (TY) using parameters longentryday=21, longbarsintrade=3, shortentryday=4, shortbarsintrade=1
- 10 Years US Treasury Note (TS) using parameters longentryday=20, longbarsintrade=4, shortentryday=3, shortbarsintrade=1
All backtest results produced by tradesq include the market-specific average slippage rates and broker commission fees.
Finally, let’s look at the results sheet of the best system executed on the Canadian Dollar. It’s a pretty neat equity curve.
Leave a Reply
You must be logged in to post a comment.