Table of Contents
Introduction
In the book “Short Term Trading Strategies That Work” by Larry Connors and Cesar Alvarez, a widely used entry strategy for Index markets is discussed, which takes advantage of the index mean reversion edge through the 2-period RSI. This RSI trading strategy involves going long only when the 2-period RSI falls below an oversold limit. In this article, we will explore whether the RSI works in different timeframes and index markets, and we will use the Volatility Index (VIX) as a filter to enhance the strategy.
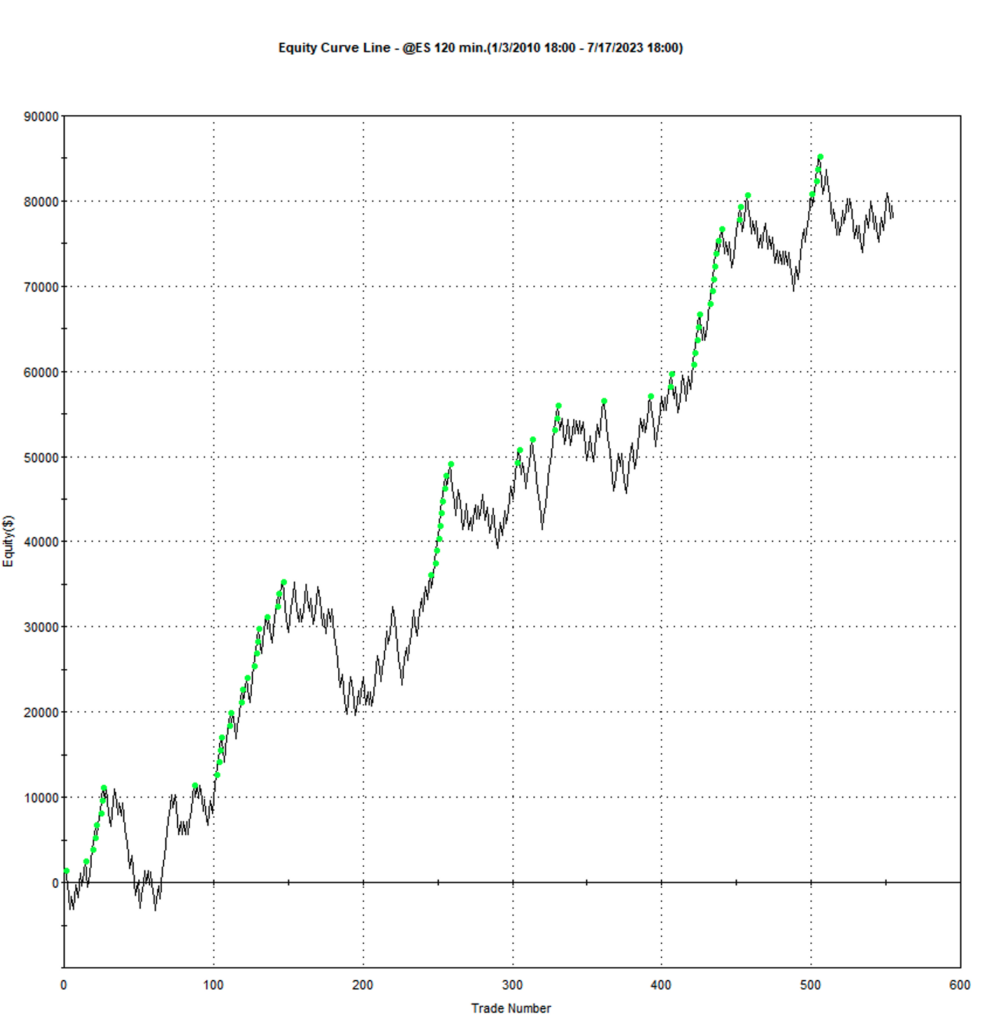
To establish a reference point, let’s consider a random pick from the ES market:
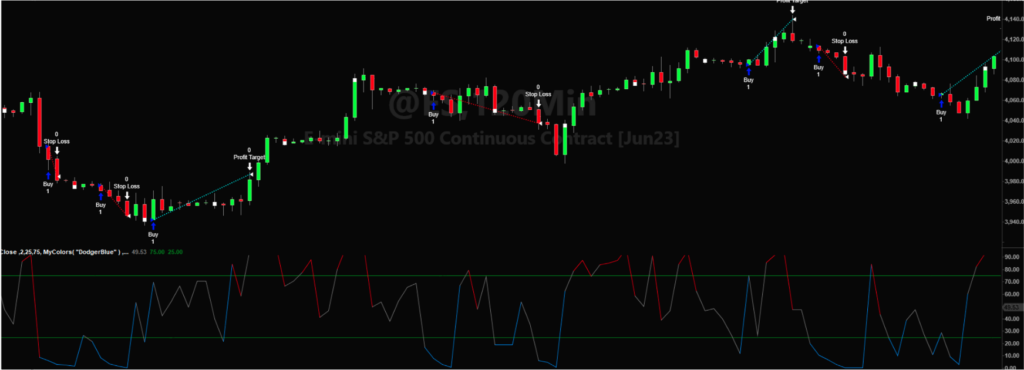
Market: @ES
Timeframe: 120 mins.
Entry RSI2 crosses below 20. (Long only).
Stop loss: $1500.
Profit target: $1500.
Slippage: $12.5 per contract.
Commission: $2.5 per trade.
Based on the above parameters, the results are as follows:
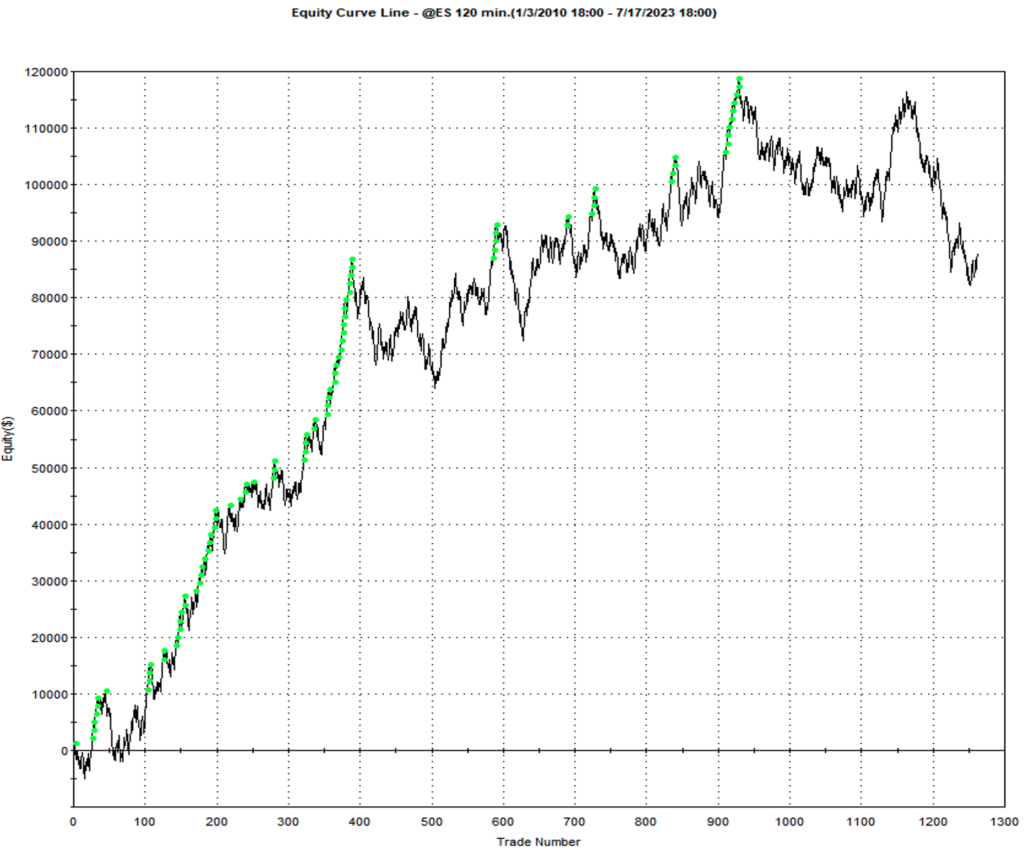
| Net Profit: | $87.977 |
| Avg Trade: | $69.7 |
| Trades: | 1.262 |
| Profit Factor: | 1,10 |
| Max DD: | $37.282 |
We could say there is an edge, but it can be further improved to increase its effectiveness by reducing the number of trades. In order to achieve this, I want to use the VIX as a filter.
Why VIX?
Let’s explore its definition:
“The Cboe Volatility Index (VIX) is a real-time index that represents the market’s expectations for the relative strength of near-term price changes of the S&P 500 Index (SPX). Because it is derived from the prices of SPX index options with near-term expiration dates, it generates a 30-day forward projection of volatility. Volatility, or how fast prices change, is often seen as a way to gauge market sentiment, and in particular the degree of fear among market participants.
The index is more commonly known by its ticker symbol and is often referred to simply as “the VIX.” It was created by the Cboe Options Exchange (Cboe) and is maintained by Cboe Global Markets. It is an important index in the world of trading and investment because it provides a quantifiable measure of market risk and investors’ sentiments.”
Source: https://www.investopedia.com/terms/v/vix.asp
As we can see from the definition, incorporating the VIX in our strategy allows us to leverage market sentiment as a filtering mechanism. To achieve this, we will consider the following cases:
- Case 1: High of the VIX is higher than X bars ago.
- Case 2: High of the VIX is lower than X bars ago.
- Case 3: VIX RSI of X number bars ago is greater than 50.
- Case 4: VIX RSI of X number bars ago is lower than 50.
- Case 5: VIX RSI of X number bars ago is greater than 80.
- Case 6: VIX RSI of X number bars ago is lower than 20.
Considerations
Charting Software: TradeStation 10.0.
Code development language: Easylanguage 10.0.
Code Considerations:
-
Entries type:
- Long only.
-
Entries Direction:
- Mean Reversion.
-
Exits:
- Stop Loss
- Profit Target: Stop Loss
-
Trigger:
- Long when Close crosses below Oversold.
- VIX Filter on data 2
First approach
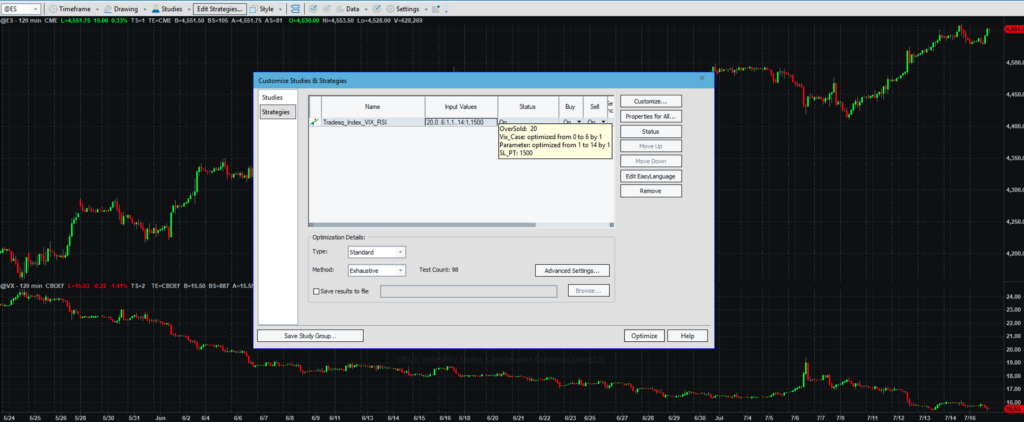
OK, now that the code is ready, let’s add Data2 to our reference strategy:
And look for the following cases and parameters:
Results
| RSI2 | RSI2 + VIX filters | |
| Net Profit: | $87.977 | $77.862 |
| Avg Trade: | $69.7 | $140.29 |
| Trades: | 1.262 | 555 |
| Profit Factor: | 1,10 | 1.21 |
| Max DD: | $37.282 | $17.862 |
The more effective filter case is number 4: where the RSI of the VIX with 7 bars back is above 50, even if the net profit is reduced, the strategy is more effective in reducing more than half of the trades, duplicating the average per trade and reducing the drawdown by $20.000.
After seeing the improvement of the strategy, some questions arise:
- Will it work in another timeframe?
- Will it work on other Index futures markets?
- What will happen if the VIX has a different timeframe from the primary Market?
This research will take me a considerable big amount of time to do it manually, so what better tool than Tradesq to help me out.
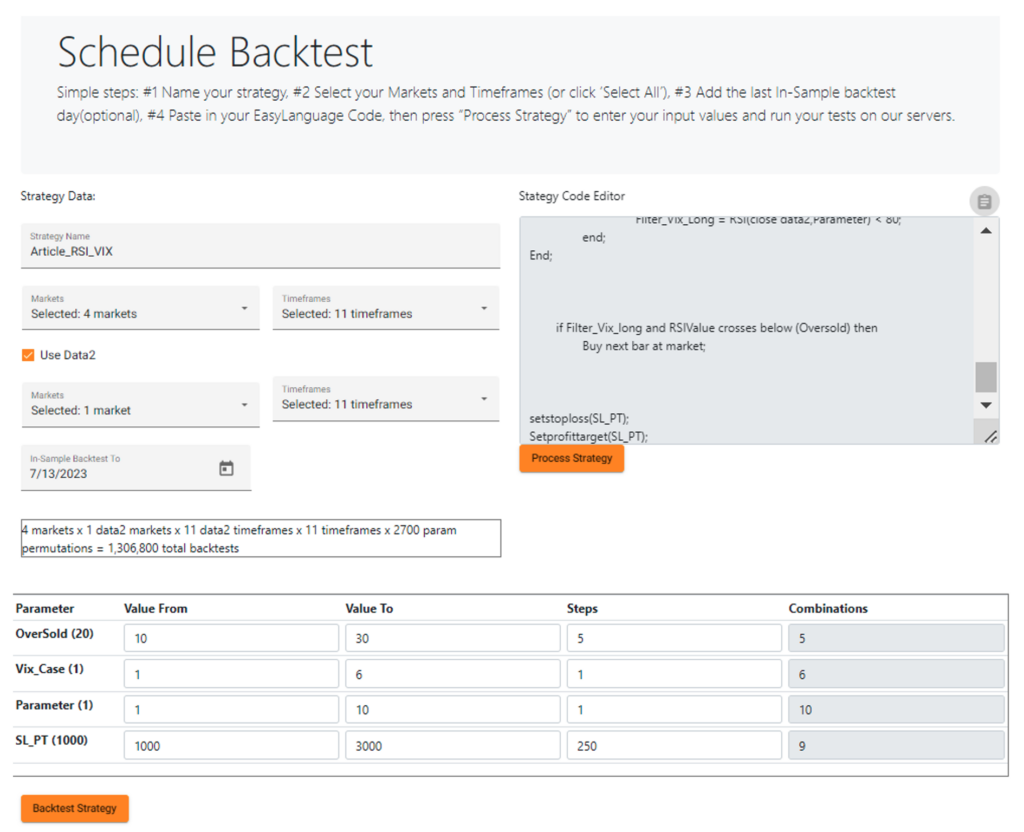
Applying Tradesq
Tradesq has been chosen as a Futures trading system research tool.
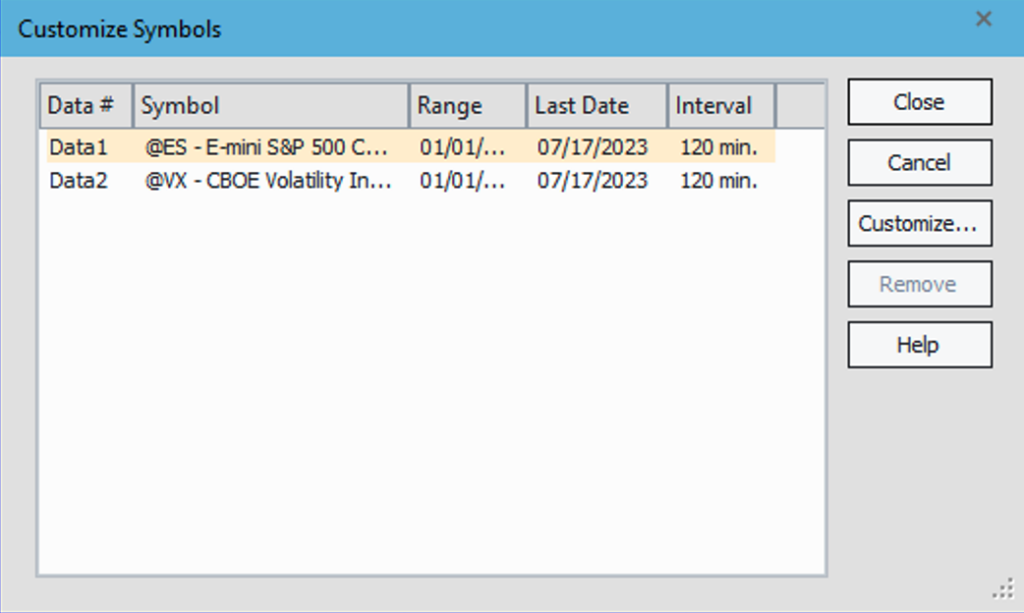
On Tradesq, I will enter the code, and on Data1, select the four main Index futures markets:
@ES: E-MINI S&P 500.
@NQ: E-MINI NASDAQ 100.
@RTY: E-MINI RUSSELL 2000.
@YM: E-MINI DOW 30.
11 timeframes, from 15 minutes to daily.
For Data 2, the market will be @VX, and timeframes from 15 minutes to daily.
Results
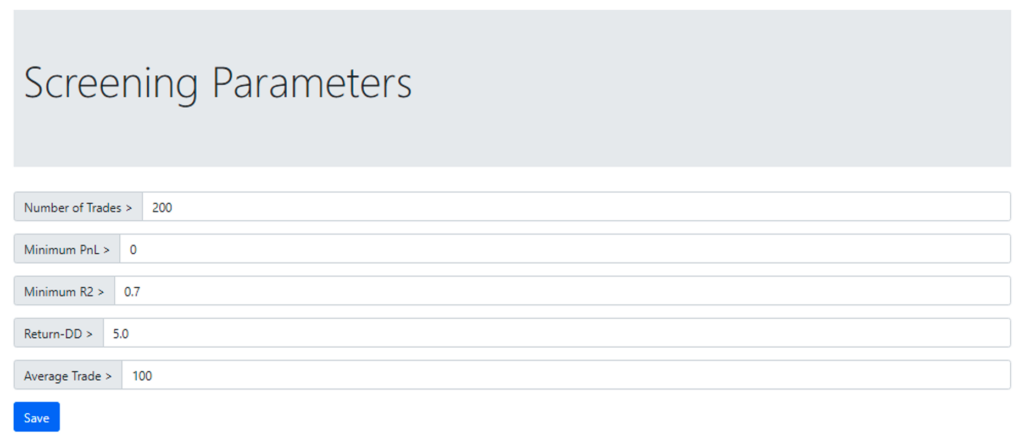
After a few hours, we obtained results based on the following criteria:
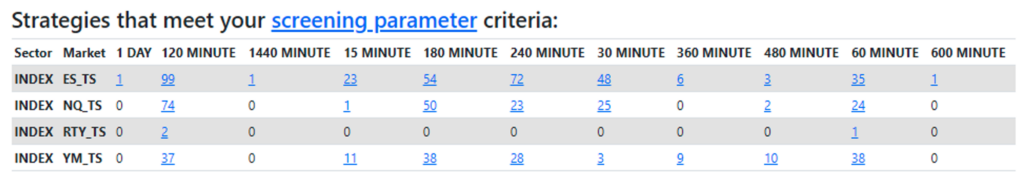
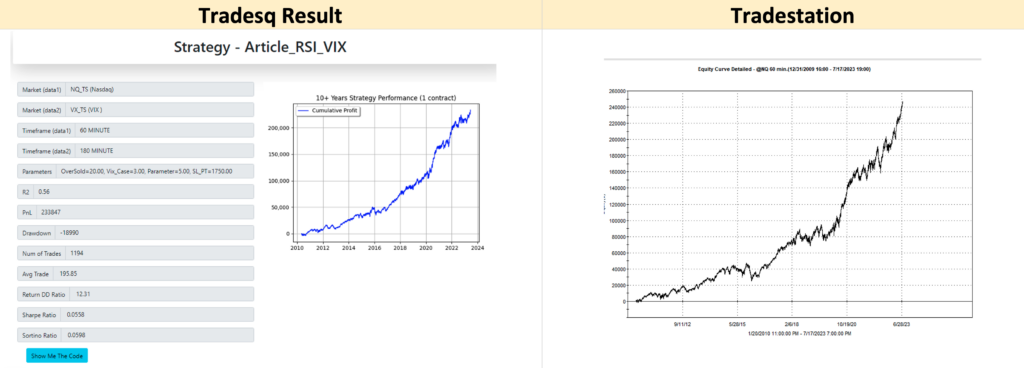
Nasdaq 60min
Data1: Nasdaq (@NQ) 60min
Data2: VIX (@VX) 180min
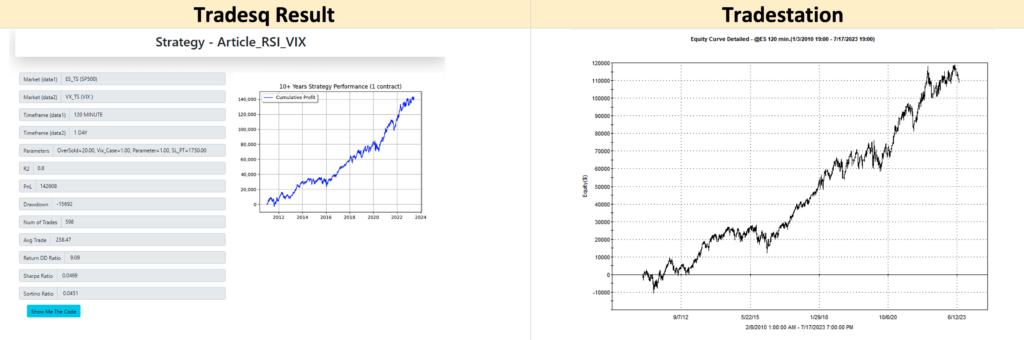
ES 120min
Data1: S&P (@ES) 120min
Data2: VIX (@VX) Daily
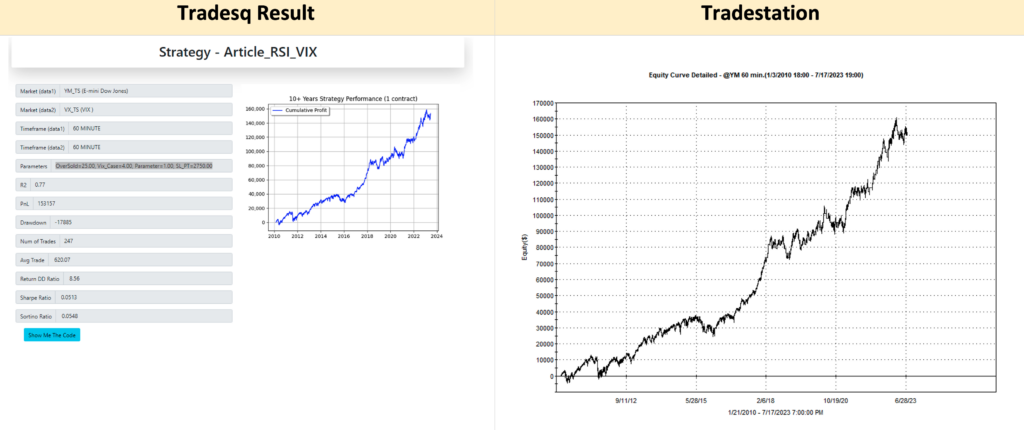
YM 60min
Data1: DOW (@YM) 60min
Data2: VIX (@VX) 60min
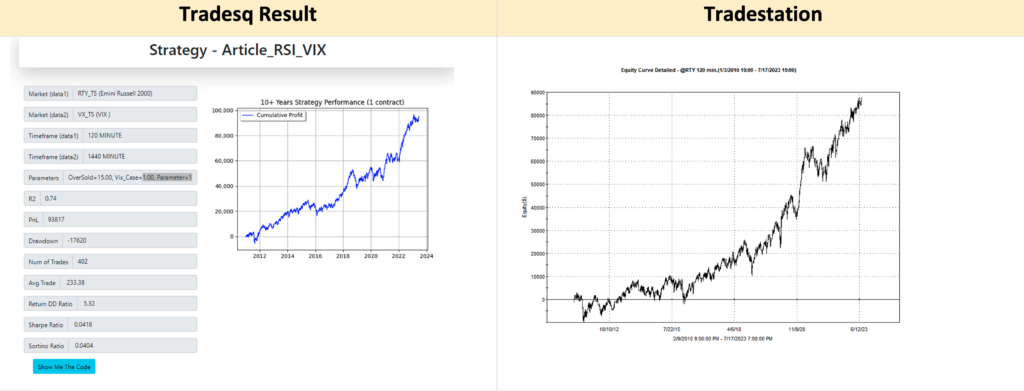
YM 120min
Data1: RTY (@YM) 120min
Data2: VIX (@VX) 1440min
Note: All results include trading costs, Slippage, and Commission.
Conclusion
Incorporating the VIX as a filter has significantly improved the RSI trading strategy’s performance across different timeframes and Index futures markets. The results show promising potential and further research and testing can be conducted to refine and optimize the strategy.
Author:
Juan Fernando Gómez
Email: jgomezv2@gmail.com
Leave a Reply
You must be logged in to post a comment.