Larry Williams is a well-known trader and author who has been involved in the financial markets for over 50 years. He is perhaps best known for his successful trading system called “The Ultimate Oscillator,” which uses moving averages and other technical indicators to identify potential trade opportunities.
One of the key principles of Williams’ trading system is the idea of “buying low and selling high.” This means that he looks for opportunities to purchase assets when they are undervalued and then sells them when they reach a higher price. Williams believes that this approach allows him to capitalize on market trends and make consistent profits over the long term.
The 3-bar system
Larry Williams’ 3-bar system is a popular technical analysis tool traders use to identify potential trade opportunities. This system uses three consecutive bars on a price chart to signal potential buying or selling opportunities.
The 3-bar system is based on the idea that the market tends to move in trends. When a stock or other asset is in an uptrend, it will often make higher highs and higher lows, which can be identified by looking at a price chart. Similarly, when a stock is in a downtrend, it will often make lower highs and lower lows.
The 3-bar system uses these trends to identify potential trade signals. For example, if a market is in an uptrend and makes three consecutive higher highs, it could be a signal to buy. Similarly, if it is in a downtrend and makes three consecutive lower lows, it could be a signal to sell.
Overall, the 3-bar system is a popular tool used by traders to identify potential trade opportunities based on trends in the market. While it is not a foolproof method and should not be used in isolation, it can be a valuable addition to a trader’s toolkit.
Testing the 3-bar system
In this article, we will see how this simple concept can be implemented in Tradestation’s EasyLanguage and how it performs when backtesting it across multiple asset sectors.
To start this research project, we used a publicly available EasyLanguage implementation for the 3-bars system:
Var: mal(0), mah(0);
mal = Average(Low,3);
mah = Average(High,3);
//Trend analyzer:
Var: trnd(0), TotalPrice(0);
TotalPrice = (O+H+L+C)/4;
Trnd = LinearRegSlope(TotalPrice, 3);
//Uptrend VS Downtrend
Var: c1(0),c2(0);
c1=(Trnd[1]>0);
c2=(Ttrnd[1]<0);
// 3-Bar System long orders
If Marketposition<=0 and c1 then BUY 1 contract at mal[1] limit;
If Marketposition=1 and c2 then SELL next bar at mah[1] limit;
// 3-Bar System short orders
If Marketposition>=0 and c2 then SELLSHORT 1 contract at mah[1] limit;
If Marketposition=-1 and c1 then BuyToCover next bar at mal[1] limit;
The concept is rather simple:
- We calculate the average bar price (Open + High + Low + Close) / 4
- We calculate a 3 days linear regression value based on the average price of the bar
- When the linear regression line is on the positive side, we consider an uptrend. When the linear regression line is on the negative side, we consider a downtrend.
- We enter the direction of the trend with limit orders. The limit price is the 3-day average of the low for the long and the 3-day average of the high for the short.
Before moving on to the backtesting phase, there is an important thing to mention. When backtesting with EasyLanguage, the danger of using limit orders is that they may not have been available at the time and on the exchange where the historical data is from, which could affect the accuracy of the backtest results.
To see how this code performs on different asset sectors and timeframes, let’s execute a backtest with Tradesq.
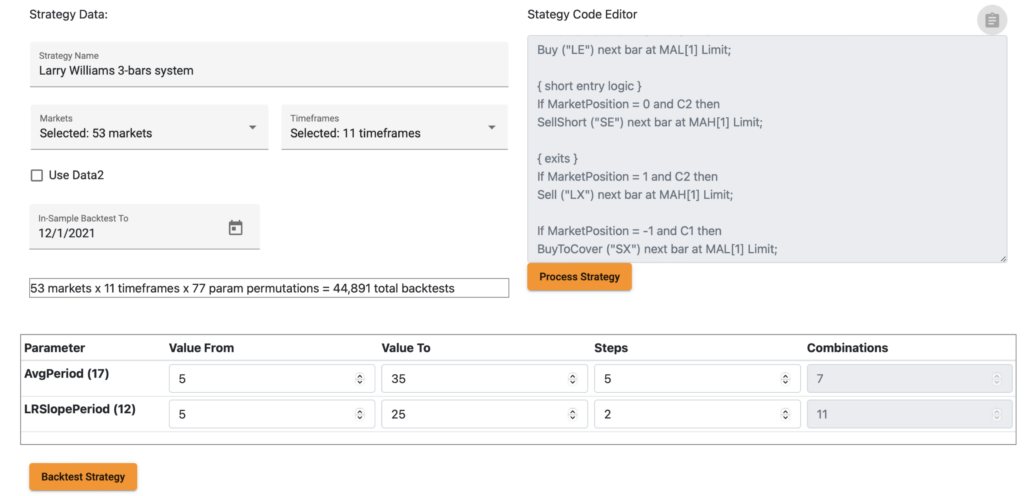
First, we open the Tradesq scheduler, and we copy and paste the EasyLanguage code to the code editor box. The next step is to define which markets and timeframes to backtest. As I like to run my backtests with at least a year of out-of-sample data, I set the desired ‘in-sample backtest to’ date.
This EasyLanguage code contains 2 optimizable input variables: AvgPeriod and LRSlopePeriod. The default variable values are 17 and 12. As we are testing this system on various markets and timeframes, a more comprehensive range of variables was defined (between 5 and 35).
Backtesting results across all market sectors
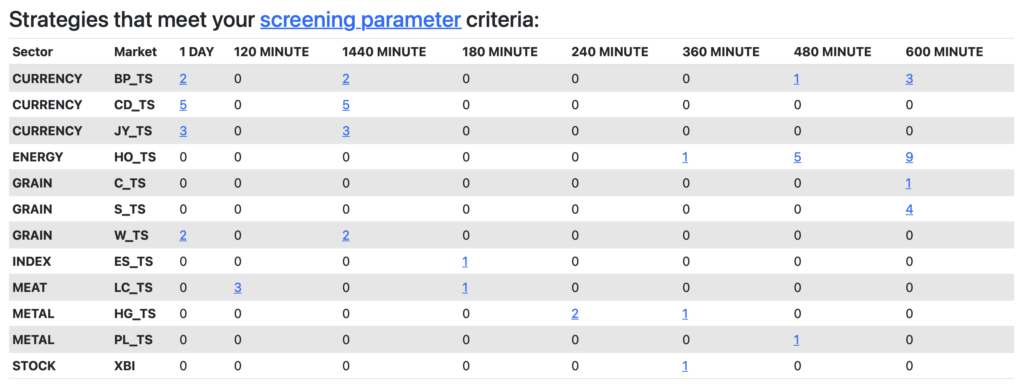
The results are pretty convincing. According to the default screening parameters, good backtesting results were found in the Currency, Energy, Grain, Index and Metal sectors. The distribution of timeframes is also extraordinary. This EasyLanguage system shows promising results at 120, 180, 240, 360, 480, 600 minutes, and 1-day bar size:
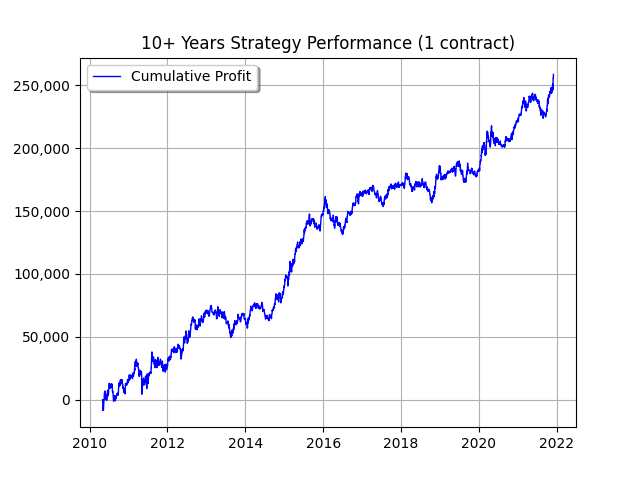
As an example, let’s inspect the backtesting results for Heating Oil (HO) on 600 minutes time resolution:
As a final warning, I must emphasize that the above-tested code cannot be considered a complete trading system. As a potential point of improvement, an entry filter and a stop-loss logic could be added.
Leave a Reply
You must be logged in to post a comment.