Recently someone asked on an Easylanguage forum if anyone had coded a Bull flag / Bear flag pattern recognition to use on a futures index strategy. I realized that I did not know the pattern, so I went and looked for it.
Bull flag pattern
A bull flag is a technical chart pattern that is often used by traders to identify potential bullish market movements. The pattern is characterized by a strong upward move, followed by a period of consolidation, or “flag,” that is usually parallel to the trendline of the initial move.
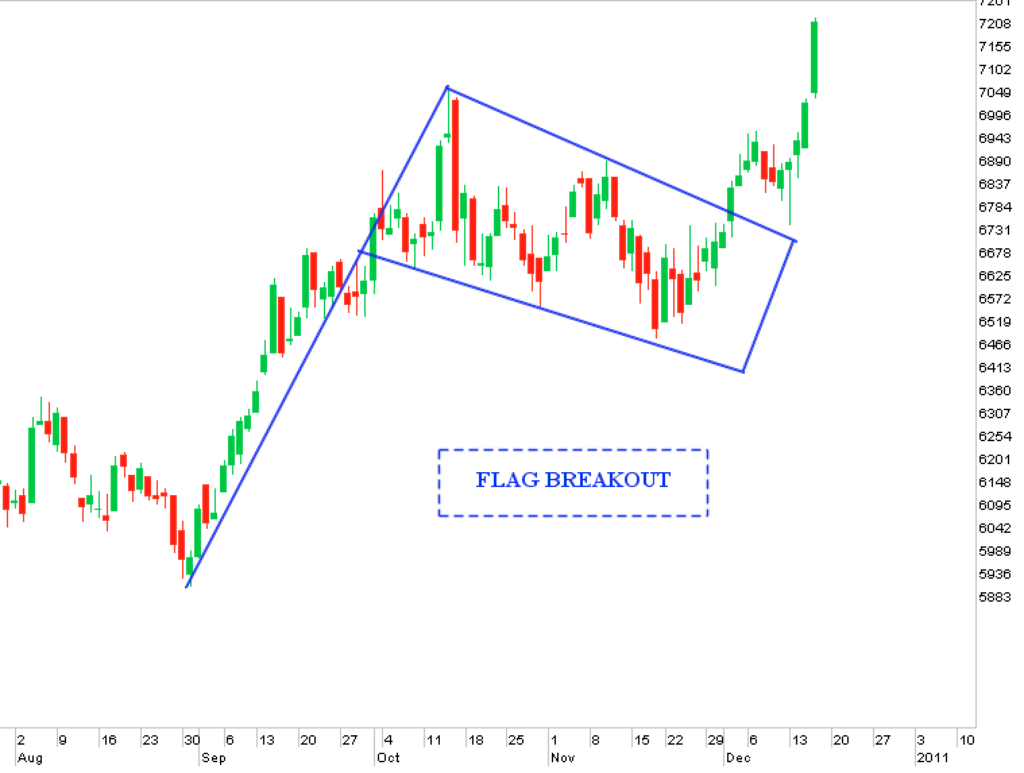
The bull flag pattern is considered a continuation pattern, as it indicates that the current bullish trend will likely continue after the consolidation period. This can be a valuable signal for traders looking to enter long positions or add to existing ones.
The pattern typically forms after a strong upward move, which is known as the “flagpole.” This initial move can be caused by a number of factors, such as positive earnings reports, strong economic data, or other market-moving news. During the consolidation period, the price of the security will generally move sideways, forming a “flag” shape on the chart.
Traders typically look for a breakout above the resistance level of the flag to confirm the continuation of the bullish trend. Additionally, traders may use a stop-loss order below the support level of the flag to protect their position in case the trend does not continue.
Bull flag in quantitative tading
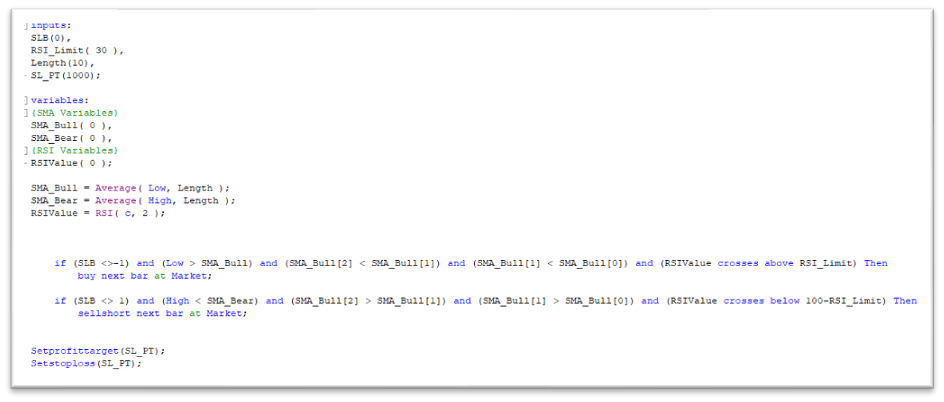
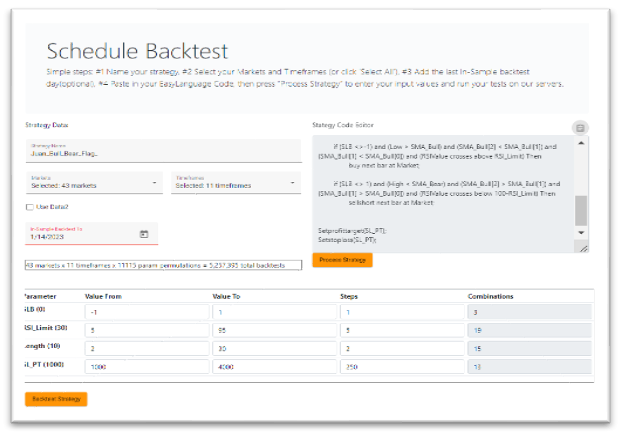
We can get as fancy as we want with Easylenguage, but I wanted to take a straightforward approach:
Flagpole: Two simple moving average (SMA).
- Bullish flagpole SMA based on the low price, and current SMA bigger than the previous two SMA´s.
- Bearish flagpole SMA based on the high price, and current SMA lover then the previous two SMA´s.
Breakout: RSI2 that breaks over limit on the direction on the trend.
Exits: Stop loss and profit target.
Long and Shorts: The ability to test only long, only short or both.
Charting Software: Tradestation 10.0
Code development: Easylenguage 10
Research platform: https://tradesq.net/
Bull Flag on futures markets? –Easylanguage code
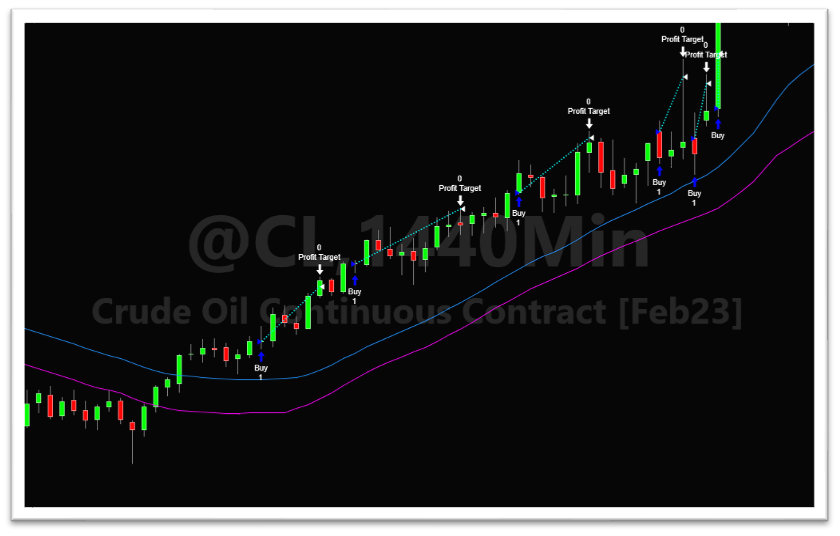
Let’s see how it works on a chart:
Long entries on Bull flag on a @CL 1440m chart
Short entries on bear flag on a @CL 1440m chart
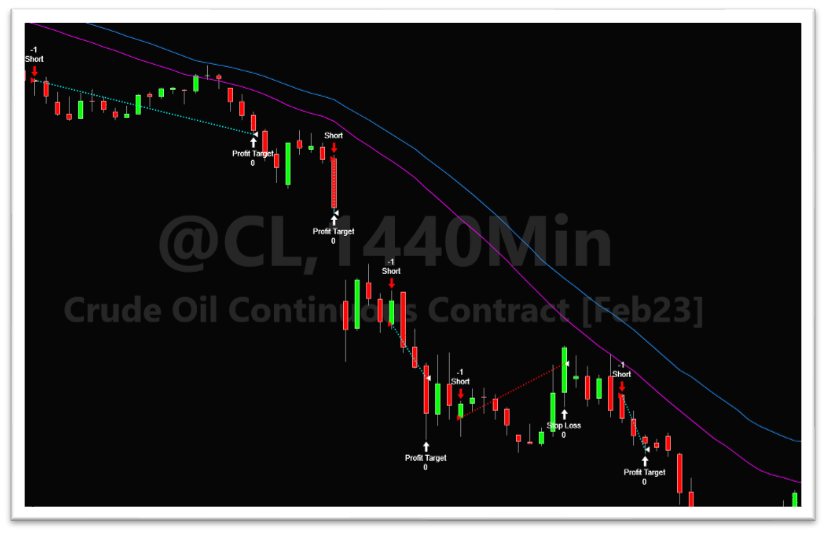
Its not perfect “flag” shape, but the concept of entering after the breakout of the retracement works pretty well.
Now that we have the code and the strategy let’s see if it would work in future markets. For the study, Tradesq will test it for us on 43 Future markets and 11 timeframes in a matter of hours. Can you imagine how much time would take to perform the test manually?
Results
We have many edges on currencies, energies, grains, Indexes, and interest sectors.
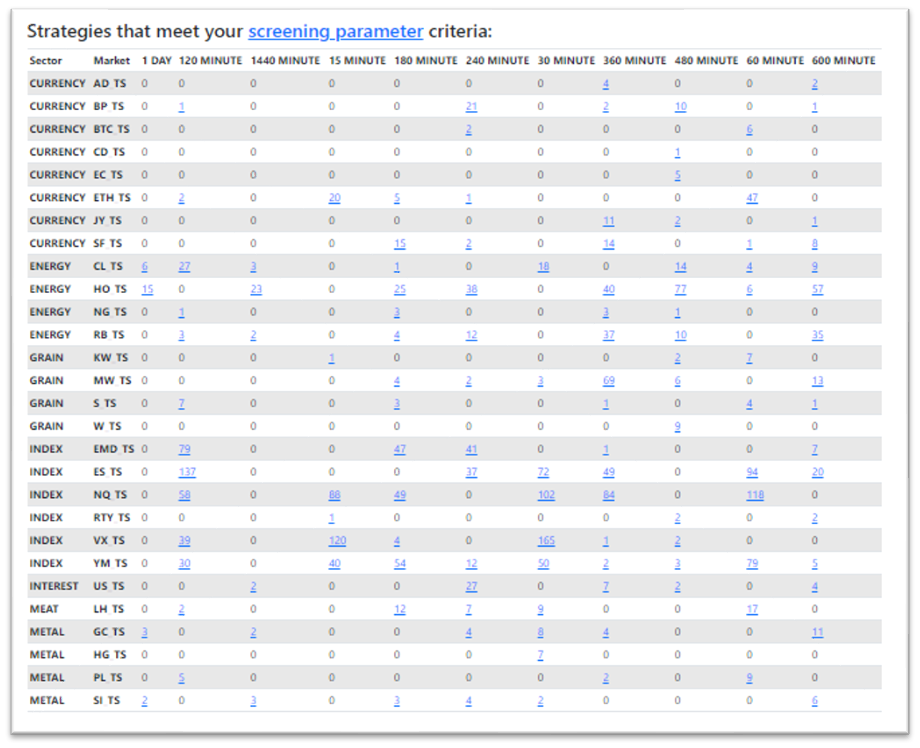
Results filtered by (NP/DD>4, Number of trades above 200)
Let’s have a look at Some results from every sector.
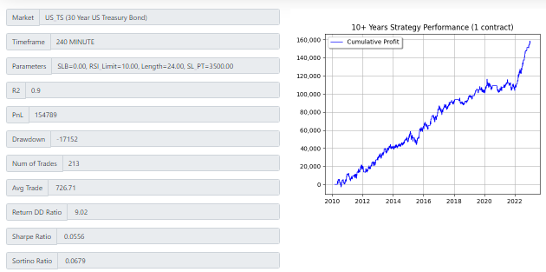
30Yr Bonds(@US) 240min
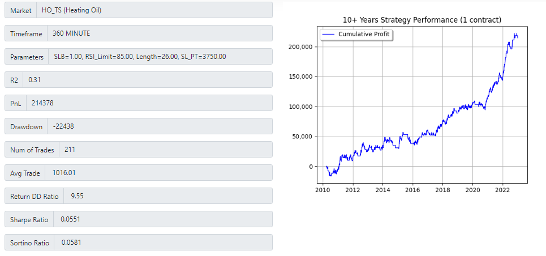
Heating Oil(@HO) 360min
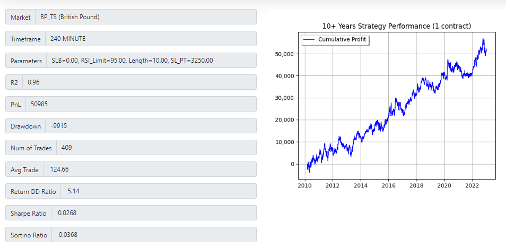
British Pound(@BP) 240min
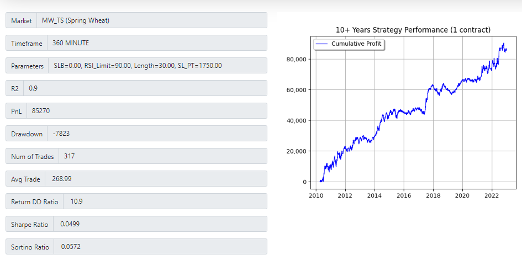
Spring Wheat(@MW) 360min
Nasdaq(@NQ) 30min
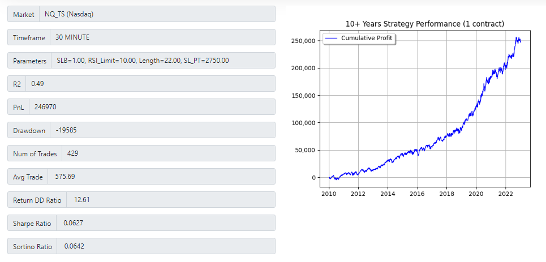
Note: All results include trading costs, Slippage and Commission.
Conclusion
I don’t know if the code developed will resolve the poster question on the Bull Bear Flag pattern, but certainly did find really good edges.
The study was intended to show how we can start from a simple idea and use tools like Tradesq and Easylanguage / Powerlanguage to build strategies. As a result, we found firm edges through five (5) different future market sectors.
It does not mean this are strategies ready to trade, additional filters and robustness tests must be applied, but is a terrific starting point.
Author:
Juan Fernando Gómez
Email: jgomezv2@jgomezv2
Leave a Reply
You must be logged in to post a comment.